Upol Ryskulova
2015-03-27 12:10:41 UTC
Hello there,Tyring to plot two real time graphs that share x-axis but have
different y-axis with different ranges. I plotted very similar graphs to
what I wanted, but it is not an exact graph I wanted. The image is as
following. I wrtoe my code based on GraphicsLayout.py sample code. But my
plotting needs a really tight modification. Since two graphs have different
ranges the y axises are not aligned in parallel.
<Loading Image...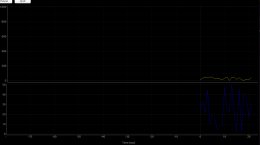 >
>
from pyqtgraph.Qt import QtGui, QtCore
import pyqtgraph as pg
import numpy as np
app = QtGui.QApplication([])
view = pg.GraphicsView()
l = pg.GraphicsLayout(border=(100,100,100))
view.setCentralItem(l)
view.show()
view.setWindowTitle('pyqtgraph example: GraphicsLayout')
view.resize(800,600)
l2 = l.addLayout(colspan=3, border=(50,0,0))
l2.setContentsMargins(10, 10, 10, 10)
l2.addLabel("Sub-layout: this layout demonstrates the use of shared axes
and axis labels", colspan=3)
l2.nextRow()
l2.addLabel('Vertical Axis Label', angle=-90, rowspan=2)
p21 = l2.addPlot()
p21.setYRange(0,1000)
l2.nextRow()
p23 = l2.addPlot()
p23.setYRange(0,50)
l2.nextRow()
l2.addLabel("HorizontalAxisLabel", col=1, colspan=1)
## hide axes on some plots
p21.hideAxis('bottom')
p21.hideButtons()
p23.hideButtons()
## Start Qt event loop unless running in interactive mode.
if __name__ == '__main__':
import sys
if (sys.flags.interactive != 1) or not hasattr(QtCore, 'PYQT_VERSION'):
QtGui.QApplication.instance().exec_()
Can you guide me, how can I achieve to that? I am noob in QT and pyqtgraph.
Thank you,
Regards,
Upol
different y-axis with different ranges. I plotted very similar graphs to
what I wanted, but it is not an exact graph I wanted. The image is as
following. I wrtoe my code based on GraphicsLayout.py sample code. But my
plotting needs a really tight modification. Since two graphs have different
ranges the y axises are not aligned in parallel.
<Loading Image...
 >
>from pyqtgraph.Qt import QtGui, QtCore
import pyqtgraph as pg
import numpy as np
app = QtGui.QApplication([])
view = pg.GraphicsView()
l = pg.GraphicsLayout(border=(100,100,100))
view.setCentralItem(l)
view.show()
view.setWindowTitle('pyqtgraph example: GraphicsLayout')
view.resize(800,600)
l2 = l.addLayout(colspan=3, border=(50,0,0))
l2.setContentsMargins(10, 10, 10, 10)
l2.addLabel("Sub-layout: this layout demonstrates the use of shared axes
and axis labels", colspan=3)
l2.nextRow()
l2.addLabel('Vertical Axis Label', angle=-90, rowspan=2)
p21 = l2.addPlot()
p21.setYRange(0,1000)
l2.nextRow()
p23 = l2.addPlot()
p23.setYRange(0,50)
l2.nextRow()
l2.addLabel("HorizontalAxisLabel", col=1, colspan=1)
## hide axes on some plots
p21.hideAxis('bottom')
p21.hideButtons()
p23.hideButtons()
## Start Qt event loop unless running in interactive mode.
if __name__ == '__main__':
import sys
if (sys.flags.interactive != 1) or not hasattr(QtCore, 'PYQT_VERSION'):
QtGui.QApplication.instance().exec_()
Can you guide me, how can I achieve to that? I am noob in QT and pyqtgraph.
Thank you,
Regards,
Upol
--
You received this message because you are subscribed to the Google Groups "pyqtgraph" group.
To unsubscribe from this group and stop receiving emails from it, send an email to pyqtgraph+***@googlegroups.com.
To view this discussion on the web visit https://groups.google.com/d/msgid/pyqtgraph/b8968a15-792e-49b3-af8c-32c8ad76be09%40googlegroups.com.
For more options, visit https://groups.google.com/d/optout.