Nicolas
2015-01-08 00:14:57 UTC
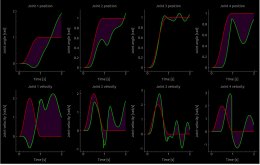
I am developing a GUI with PySide where I have a PyQtGraph GraphicsView
with multiple plots (see the image below). Graphics View to a
GraphicsLayoutWidget. The GUI is designed in Qt Designer, where I promote a
Graphics View to a GraphicsLayoutWidget.
<Loading Image... >
>
I would like to add a legend to add a legend to this. But rather than
adding a legend to each of the 8 plots, which would be redundant, I want to
add one legend that contains one entry for a green line and one entry for a
red line. Ideally, this legend would be at the bottom center of the
GraphicsView and the two entries would be side by side (as opposed to on
top of each other), in order to waste the least amount of space.
The relevant code where I add the plots is as follows:
DOF = 4
# remove any old plots
for i in range(DOF):
item = self.graphicsView.getItem(0,i)
if item != None:
self.graphicsView.removeItem(item)
item = self.graphicsView.getItem(1,i)
if item != None:
self.graphicsView.removeItem(item)
pg.setConfigOptions(antialias=True)
pen_act = pg.mkPen((0,200,0,255), width=2)
pen_des = pg.mkPen((200,0,0,255), width=2)
brush_fill = (100,0,100,100)
# result is a dictionary containing the data to be plotted
time = result['time'];
del result['time']
for i in range(1,DOF+1):
# position
fig = self.graphicsView.addPlot(row=0, col=i-1, title="Joint "+str(i)+"
position", labels={'left': "Joint angle [rad]", 'bottom': "Time [s]"})
plot1 = fig.plot(x=time, y=result["joint" + str(i) + "_pos_act"], pen=
pen_act)
plot2 = fig.plot(x=time, y=result["joint" + str(i) + "_pos_des"], pen=
pen_des)
fill = pg.FillBetweenItem(plot1, plot2, brush=brush_fill)
fig.addItem(fill)
# velocity
fig = self.graphicsView.addPlot(row=1, col=i-1, title="Joint "+str(i)+"
velocity", labels={'left': "Joint velocity [rad/s]", 'bottom': "Time [s]"})
plot1 = fig.plot(x=time, y=result["joint" + str(i) + "_vel_act"], pen=
pen_act)
plot2 = fig.plot(x=time, y=result["joint" + str(i) + "_vel_des"], pen=
pen_des)
fill = pg.FillBetweenItem(plot1, plot2, brush=brush_fill)
fig.addItem(fill)
How can I achieve this?
I tried to do what is suggested here
<https://groups.google.com/forum/#!msg/pyqtgraph/gASDBfH7Ijo/1CrAMp5v4TgJ>,
but I can't get it to work properly. The legend appears, but it's behind
the plots, so I can only see a little bit of it just at the edge of the
view. Also, this
with multiple plots (see the image below). Graphics View to a
GraphicsLayoutWidget. The GUI is designed in Qt Designer, where I promote a
Graphics View to a GraphicsLayoutWidget.
<Loading Image...
I would like to add a legend to add a legend to this. But rather than
adding a legend to each of the 8 plots, which would be redundant, I want to
add one legend that contains one entry for a green line and one entry for a
red line. Ideally, this legend would be at the bottom center of the
GraphicsView and the two entries would be side by side (as opposed to on
top of each other), in order to waste the least amount of space.
The relevant code where I add the plots is as follows:
DOF = 4
# remove any old plots
for i in range(DOF):
item = self.graphicsView.getItem(0,i)
if item != None:
self.graphicsView.removeItem(item)
item = self.graphicsView.getItem(1,i)
if item != None:
self.graphicsView.removeItem(item)
pg.setConfigOptions(antialias=True)
pen_act = pg.mkPen((0,200,0,255), width=2)
pen_des = pg.mkPen((200,0,0,255), width=2)
brush_fill = (100,0,100,100)
# result is a dictionary containing the data to be plotted
time = result['time'];
del result['time']
for i in range(1,DOF+1):
# position
fig = self.graphicsView.addPlot(row=0, col=i-1, title="Joint "+str(i)+"
position", labels={'left': "Joint angle [rad]", 'bottom': "Time [s]"})
plot1 = fig.plot(x=time, y=result["joint" + str(i) + "_pos_act"], pen=
pen_act)
plot2 = fig.plot(x=time, y=result["joint" + str(i) + "_pos_des"], pen=
pen_des)
fill = pg.FillBetweenItem(plot1, plot2, brush=brush_fill)
fig.addItem(fill)
# velocity
fig = self.graphicsView.addPlot(row=1, col=i-1, title="Joint "+str(i)+"
velocity", labels={'left': "Joint velocity [rad/s]", 'bottom': "Time [s]"})
plot1 = fig.plot(x=time, y=result["joint" + str(i) + "_vel_act"], pen=
pen_act)
plot2 = fig.plot(x=time, y=result["joint" + str(i) + "_vel_des"], pen=
pen_des)
fill = pg.FillBetweenItem(plot1, plot2, brush=brush_fill)
fig.addItem(fill)
How can I achieve this?
I tried to do what is suggested here
<https://groups.google.com/forum/#!msg/pyqtgraph/gASDBfH7Ijo/1CrAMp5v4TgJ>,
but I can't get it to work properly. The legend appears, but it's behind
the plots, so I can only see a little bit of it just at the edge of the
view. Also, this
--
You received this message because you are subscribed to the Google Groups "pyqtgraph" group.
To unsubscribe from this group and stop receiving emails from it, send an email to pyqtgraph+***@googlegroups.com.
To view this discussion on the web visit https://groups.google.com/d/msgid/pyqtgraph/2def6e54-f848-4217-8413-e91a5e43c38c%40googlegroups.com.
For more options, visit https://groups.google.com/d/optout.