dhabbyc
2018-07-05 19:05:21 UTC
Hello,
I'm a little bit confused: i have a windows OS and both PySide (1.2.4) and
PyQt4 installed.
When I run the "histogram" example just as it is, pyqtgraph chooses pyqt4,
and the histogram look like expected:
<Loading Image... >
>
But when I use PySide, this is the result:
<Loading Image... >
>
When I click and drag the image, the plot appears, but no axes:
<Loading Image...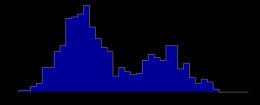 >
>
Is this a bug or I'm doing something wrong.
This is the script I'm using:
*# -*- coding: utf-8 -*-*
*"""*
*In this example we draw two different kinds of histogram.*
*"""*
*#import initExample ## Add path to library (just for examples; you do not
need this)*
*#import PySide*
*import pyqtgraph as pg*
*from pyqtgraph.Qt import QtCore, QtGui, USE_PYSIDE, USE_PYQT4*
*import numpy as np*
*print pg.USE_PYSIDE, pg.USE_PYQT4*
*win = pg.GraphicsWindow()*
*win.resize(800,350)*
*win.setWindowTitle('pyqtgraph example: Histogram')*
*plt1 = win.addPlot()*
*#plt2 = win.addPlot()*
*## make interesting distribution of values*
*vals = np.hstack([np.random.normal(size=500), np.random.normal(size=260,
loc=4)])*
*## compute standard histogram*
*y,x = np.histogram(vals, bins=np.linspace(-3, 8, 40))*
*## Using stepMode=True causes the plot to draw two lines for each sample.*
*## notice that len(x) == len(y)+1*
*plt1.plot(x, y, stepMode=True, fillLevel=0, brush=(0,0,255,150))*
*## Now draw all points as a nicely-spaced scatter plot*
*#y = pg.pseudoScatter(vals, spacing=0.15)*
*#plt2.plot(vals, y, pen=None, symbol='o', symbolSize=5)*
*#plt2.plot(vals, y, pen=None, symbol='o', symbolSize=5,
symbolPen=(255,255,255,200), symbolBrush=(0,0,255,150))*
*## Start Qt event loop unless running in interactive mode or using pyside.*
*if __name__ == '__main__':*
* import sys*
* if (sys.flags.interactive != 1) or not hasattr(QtCore,
'PYQT_VERSION'):*
* QtGui.QApplication.instance().exec_()*
Could someone help me please?
I'm a little bit confused: i have a windows OS and both PySide (1.2.4) and
PyQt4 installed.
When I run the "histogram" example just as it is, pyqtgraph chooses pyqt4,
and the histogram look like expected:
<Loading Image...
 >
>But when I use PySide, this is the result:
<Loading Image...
 >
>When I click and drag the image, the plot appears, but no axes:
<Loading Image...
 >
>Is this a bug or I'm doing something wrong.
This is the script I'm using:
*# -*- coding: utf-8 -*-*
*"""*
*In this example we draw two different kinds of histogram.*
*"""*
*#import initExample ## Add path to library (just for examples; you do not
need this)*
*#import PySide*
*import pyqtgraph as pg*
*from pyqtgraph.Qt import QtCore, QtGui, USE_PYSIDE, USE_PYQT4*
*import numpy as np*
*print pg.USE_PYSIDE, pg.USE_PYQT4*
*win = pg.GraphicsWindow()*
*win.resize(800,350)*
*win.setWindowTitle('pyqtgraph example: Histogram')*
*plt1 = win.addPlot()*
*#plt2 = win.addPlot()*
*## make interesting distribution of values*
*vals = np.hstack([np.random.normal(size=500), np.random.normal(size=260,
loc=4)])*
*## compute standard histogram*
*y,x = np.histogram(vals, bins=np.linspace(-3, 8, 40))*
*## Using stepMode=True causes the plot to draw two lines for each sample.*
*## notice that len(x) == len(y)+1*
*plt1.plot(x, y, stepMode=True, fillLevel=0, brush=(0,0,255,150))*
*## Now draw all points as a nicely-spaced scatter plot*
*#y = pg.pseudoScatter(vals, spacing=0.15)*
*#plt2.plot(vals, y, pen=None, symbol='o', symbolSize=5)*
*#plt2.plot(vals, y, pen=None, symbol='o', symbolSize=5,
symbolPen=(255,255,255,200), symbolBrush=(0,0,255,150))*
*## Start Qt event loop unless running in interactive mode or using pyside.*
*if __name__ == '__main__':*
* import sys*
* if (sys.flags.interactive != 1) or not hasattr(QtCore,
'PYQT_VERSION'):*
* QtGui.QApplication.instance().exec_()*
Could someone help me please?
--
You received this message because you are subscribed to the Google Groups "pyqtgraph" group.
To unsubscribe from this group and stop receiving emails from it, send an email to pyqtgraph+***@googlegroups.com.
To view this discussion on the web visit https://groups.google.com/d/msgid/pyqtgraph/5c68ea89-11de-46ec-9cbd-41847d988cf8%40googlegroups.com.
For more options, visit https://groups.google.com/d/optout.