Kenneth Nielsen
2016-06-16 08:11:04 UTC
<Loading Image...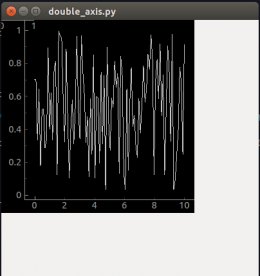 >
>
Hallo pyqtgraph developers and thanks for an awesome package
I want to embed a pyqtgraph Qt Widget into my own Qt program and I want to
use a custom xaxis (with time formatting, but that is besides the point).
When I try to do it by supplying the axisItem argument to PlotWidget I do
get the new axis in place, but I also still have the old x-axis hanging at
the top left of the widget. The following is the smallest code example that
I can use to reproduce the proble
import sys
import numpy as np
from pyqtgraph import PlotWidget, AxisItem
from PyQt4 import QtGui, QtCore
class TimeAxisItem(AxisItem):
"""Only included to show that the point is to subclass"""
class Example(QtGui.QWidget):
def __init__(self):
super(Example, self).__init__()
self.setGeometry(300, 300, 1000, 1000)
self.plot = PlotWidget(self, axisItems={'bottom': TimeAxisItem(
orientation='bottom')})
self.plot.resize(900, 900)
self.curve = self.plot.plot(np.linspace(0, 10, 100), np.random.
random(100))
self.show()
if __name__ == '__main__':
app = QtGui.QApplication(sys.argv)
ex = Example()
sys.exit(app.exec_())
Which produces the Window shown in the attached image.
Am I doing it wrong? I should say, that I can produce the correct result
(dateformatting of xaxis without the hanging axis) by simply getting the
existing xaxis and monkey patching tickStrings, but I would rather not have
to do that.
Regards Kenneth
 >
>Hallo pyqtgraph developers and thanks for an awesome package
I want to embed a pyqtgraph Qt Widget into my own Qt program and I want to
use a custom xaxis (with time formatting, but that is besides the point).
When I try to do it by supplying the axisItem argument to PlotWidget I do
get the new axis in place, but I also still have the old x-axis hanging at
the top left of the widget. The following is the smallest code example that
I can use to reproduce the proble
import sys
import numpy as np
from pyqtgraph import PlotWidget, AxisItem
from PyQt4 import QtGui, QtCore
class TimeAxisItem(AxisItem):
"""Only included to show that the point is to subclass"""
class Example(QtGui.QWidget):
def __init__(self):
super(Example, self).__init__()
self.setGeometry(300, 300, 1000, 1000)
self.plot = PlotWidget(self, axisItems={'bottom': TimeAxisItem(
orientation='bottom')})
self.plot.resize(900, 900)
self.curve = self.plot.plot(np.linspace(0, 10, 100), np.random.
random(100))
self.show()
if __name__ == '__main__':
app = QtGui.QApplication(sys.argv)
ex = Example()
sys.exit(app.exec_())
Which produces the Window shown in the attached image.
Am I doing it wrong? I should say, that I can produce the correct result
(dateformatting of xaxis without the hanging axis) by simply getting the
existing xaxis and monkey patching tickStrings, but I would rather not have
to do that.
Regards Kenneth
--
You received this message because you are subscribed to the Google Groups "pyqtgraph" group.
To unsubscribe from this group and stop receiving emails from it, send an email to pyqtgraph+***@googlegroups.com.
To view this discussion on the web visit https://groups.google.com/d/msgid/pyqtgraph/bac5582d-6d99-4917-97a2-ed6e4e5c460d%40googlegroups.com.
For more options, visit https://groups.google.com/d/optout.